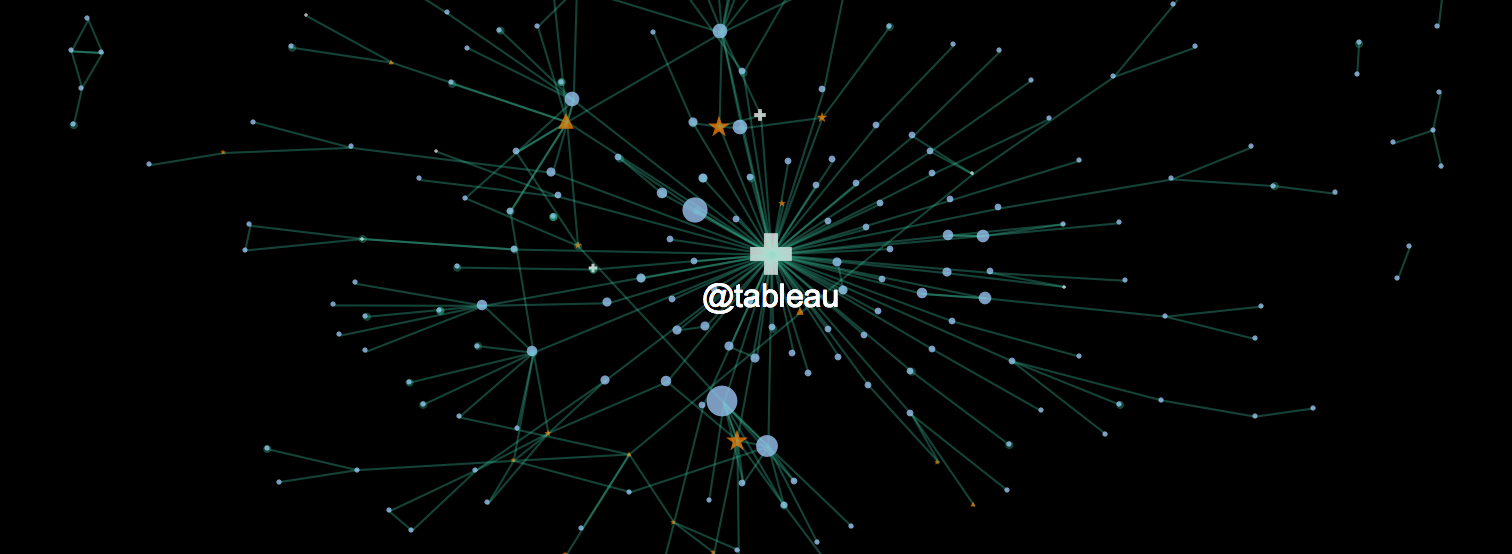
For the 2016 Tableau Conference in Austin, and I have unified our previously separate work on building Twitter network graphs in Tableau.
Incorporating text analytics, our aim was to update the view at steady increments throughout the conference.
You can find our earlier pieces on Tableau Public at these links:
And here is the :
Project Wrap-Up
Chris has published his write-up about the project . For my retrospective, I will highlight aspects of the data pipeline, the tool sets, and the collaboration.
Vectorization
Various pre-compute steps were executed independently within the overall workflow for each topic:
- keyword parsing (Python)
- keyword scoring (Python)
- network coordinates generation (R)
- network centrality measurements (R)
- orchestration & data reshaping (Alteryx)
So, with 28 topics, you can imagine that I didn't want to run these five steps manually, for each topic on every data refresh! So vectorizing these individual components inside of the overarching workflow was important for automation.
Multi Disciplinary
Making use of four tools, Python > Alteryx > R > Tableau, our pipeline was rather sophisticated.
Each tool has an inherent strength, and it follows naturally that all four analytics environments had a part to play. As craftsmen, we can achieve so much more by weaving together the strengths of separate tools than we could by working in a single environment in isolation.
This was one of my greatest take-aways from the project.
It Takes a Village
My other largest take-away is the power of embracing widely diverse individuals. Chris and I were the principal actors. And yet, valuable contribution from a wide variety of individual skill sets was needed to bring this complex effort to fruition:
- Ronald Sujithan
- Python for harvesting twitter data
- Python for keywords parsing and scoring
- Chris DeMartini:
- Visual design & concept
- Hive plots in Tableau
- Dynamic parameters in Alteryx
- Bora Beran:
- Inspiration for network analysis in R
- Keith Helfrich:
- Vectorized R code for network analysis
- Network graph + etc in Tableau
- Overall data pipeline in Alteryx
- Joe Mako:
- Cartesian join for "inbound first degree"
- Understanding final granularity in Tableau
- Alteryx assist for Hive plot reshaping
- Ali Sayeed:
- Help with vectorization in Alteryx
- Pavel Mizenin:
- Vectorizing Ronald's keywords code
- Jonathan Drummey:
- Quality assurance & ideation
Weaving together this multi-contributor collaboration was the most rewarding of the project experiences!
Word Count: 396
References
- Chris DeMartini, Tableau Public, November 17, 2016
- Tableau Conference Twitter Networks, Keith Helfrich, Tableau Public
- Tableau Conference Over the Years, Chris DeMartini, Tableau Public
- #Data16 Twitter Network Project, Chris DeMartini, DataBlick, November 17, 2016
- TC16 Twitter Networks, Keith Helfrich, Tableau Public, November 17, 2016